


Quail Run Energy Center
Owned by Starwood Energy Group Global
Operated by NAES Corp
550 MW, two 2 × 1 7EA-powered combined cycles equipped with A10 steam turbines, located in Odessa, Tex
Plant manager: Andy Duncan
Background. When Plant Engineer Ed Nielsen arrived at Quail Run Energy Center about three years ago, the facility did not have any processes to monitor plant thermal performance beyond heat rate.
He took advantage of the performance equations in PI to create compressor-efficiency, live heat-rate, and steam-cycle/Rankine-Cycle enthalpy calculations. The well-traveled engineer told the editors he was surprised more facilities did not use available steam functions in their performance analyses because it is easier to trend pressure/temperature variations as enthalpy.
This also is beneficial to operators because a temperature or pressure change alone may tell the whole story.
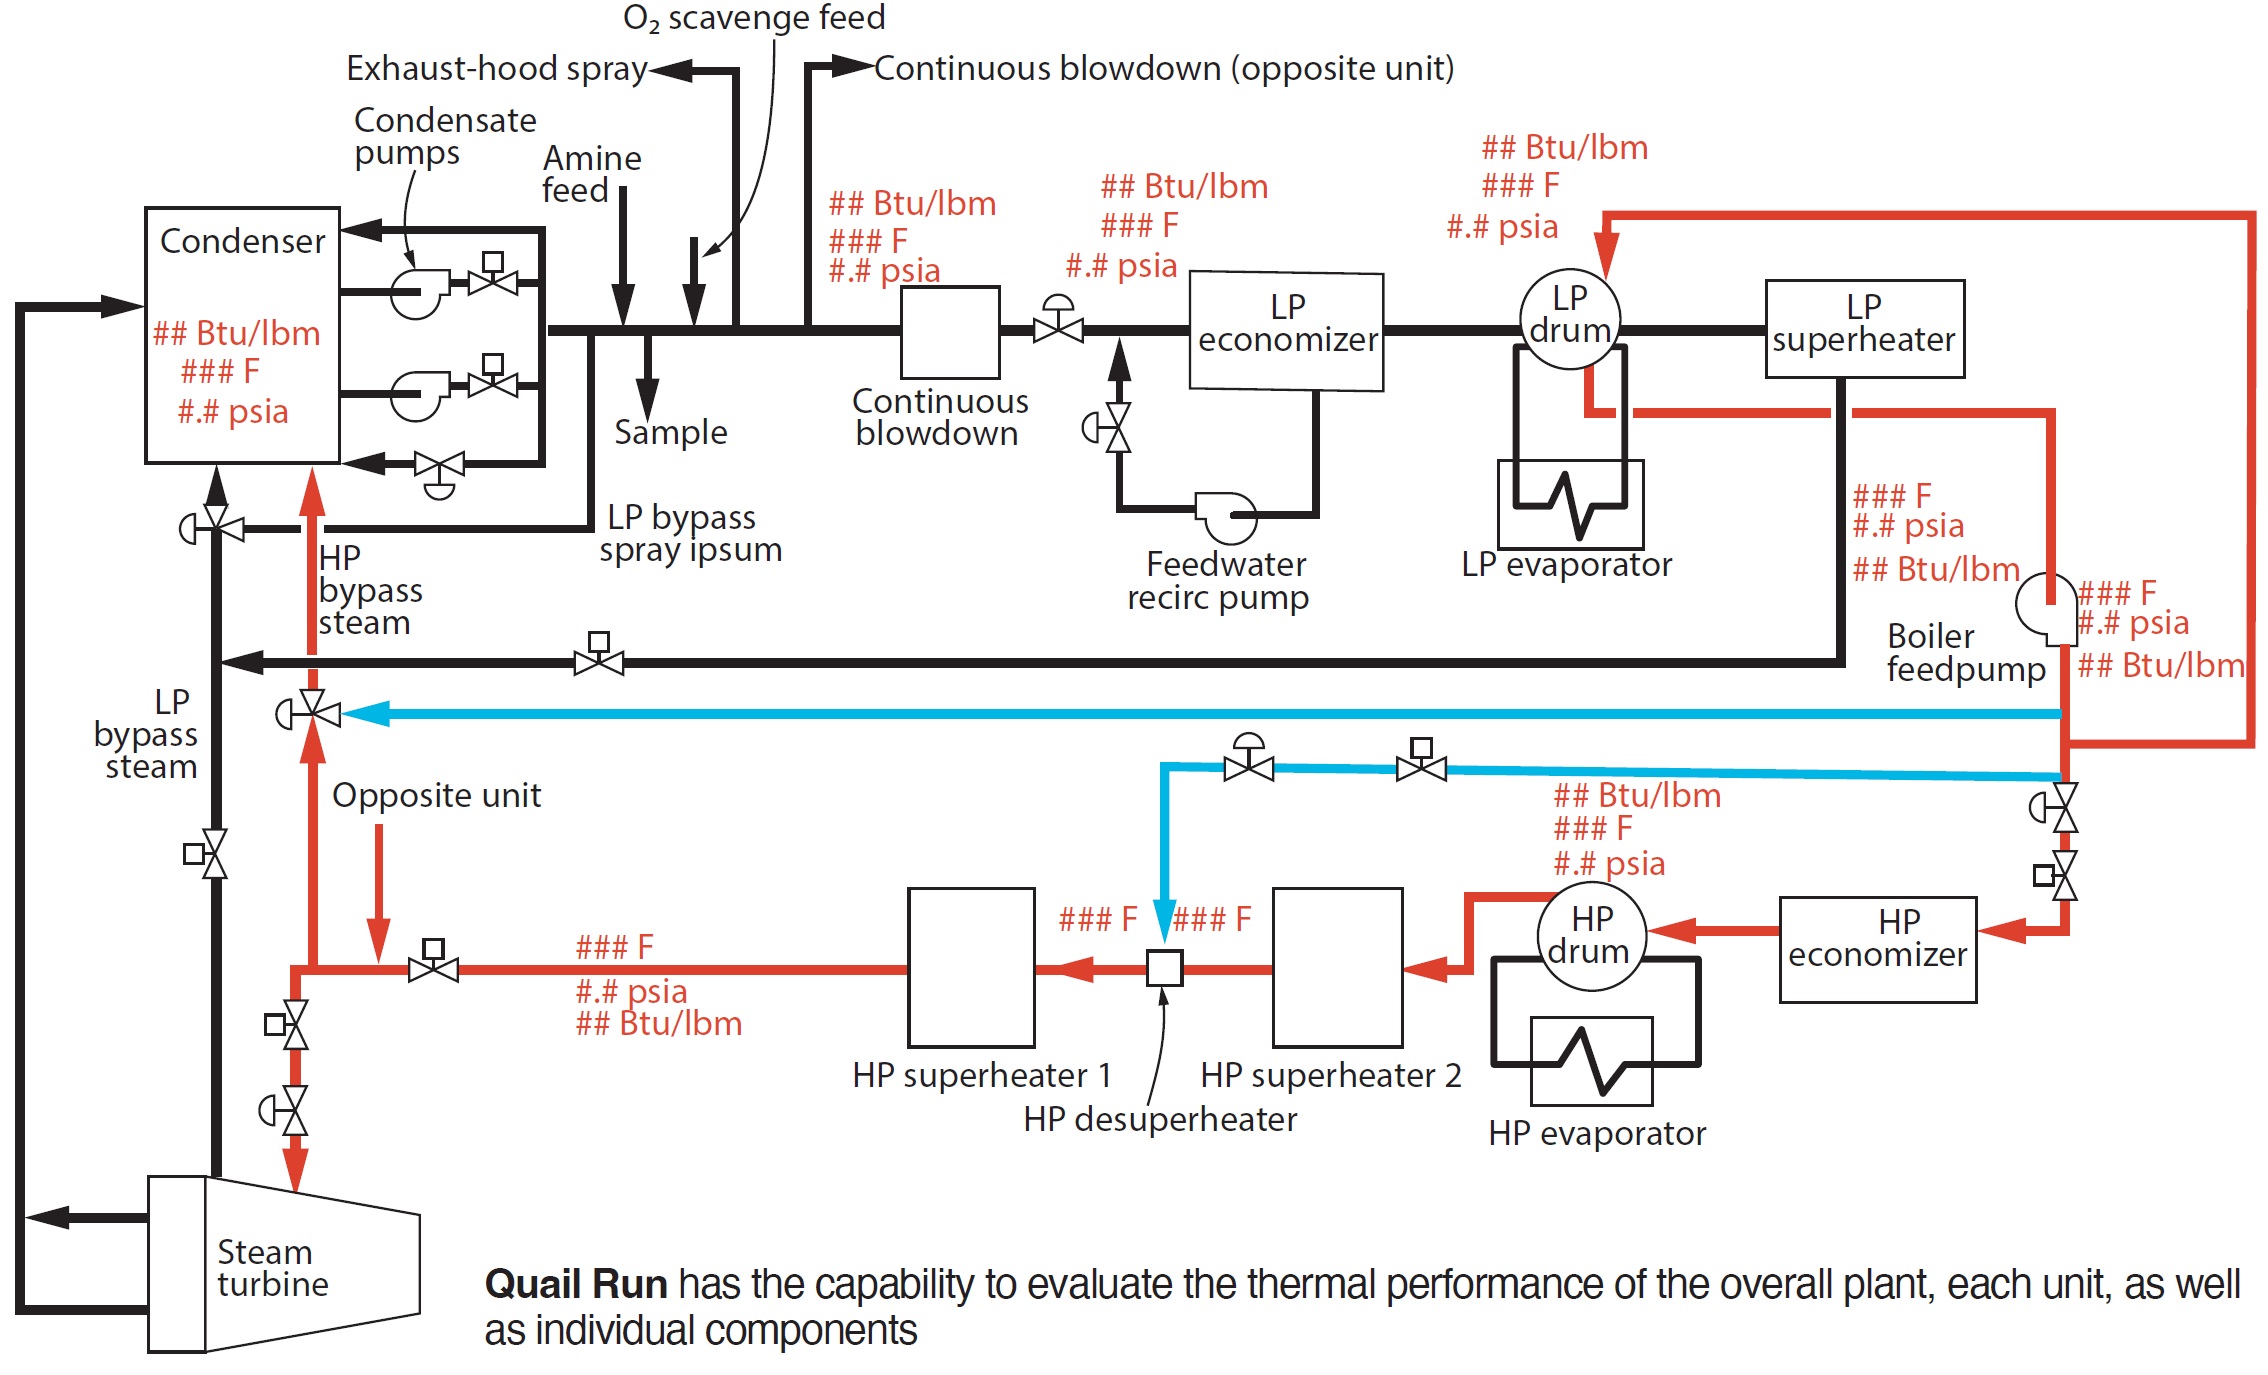
Challenge. Develop a robust monitoring program to evaluate the thermal performance of the overall plant, each of the two units, and individual components. Typically, an operator on shift would monitor temperatures, pressures, and flows, along with component operating status and system configuration. However, a proper thermal analysis is not always possible when using changes in temperatures and pressures alone.
Solution. By taking advantage of steam functions and performance equations in the plant’s trending software, personnel were able to take this a step further and perform energy analyses of Quail Run’s systems and components.
Steam functions and performance equations enable the calculation of live enthalpy values throughout the various plant systems, allowing staff to apply Bernoulli’s principle to analyze system and component performance. Recall that Bernoulli’s equation is simply:
KE1 + PE1 + P1V1 + U1 + Q = KE2 + PE2 + P2V2 + U2 + W
where
KE = kinetic energy,
PE = potential energy,
PV = pressure energy,
U = internal energy,
Q = heat transfer,
W = work, and
PV + U = h (enthalpy).
For the purpose of analyzing heat exchangers and pumps, Quail Run staff assumes no significant change in potential energy or kinetic energy, thereby reducing the equation to:
H1 + Q = H2 + W
where
Q = H2 – H1 for heat exchangers and
W = H2 – H1 for pumps and turbines.
By evaluating the enthalpy change for each component in the steam cycle, you can quickly determine the energy added by pumps in the system, the heat transfer done by heat exchangers, and the work done by turbines—thereby eliminating the guesswork when multiple parameters change. Trending the historical change in enthalpy over a system or component allows you to quickly monitor for changes in performance.
Nielsen and colleagues are able to use live calculations in their trending software, but this also can be done manually using steam tables or the Mollier diagram. Plus, there also are third-party Excel add-ons to perform steam-function calculations.
Quail Run personnel have incorporated these values into their trending software screens for live analysis in addition to extracting data into Excel to monitor historical performance.
Results. Use of the process described adds another tool to allow staff to monitor pump and heat-exchanger performance, desuperheater valves, approach temperatures, and overall performance.
Project participant:
Edward Nielsen, plant engineer