Metroscope, a relatively new entrant (2023 launch) to the US real-time powerplant process diagnostic software market, recently conducted a webinar to build more awareness of its technology and to differentiate it from other packages (some of which have been evolving since the early 1990s and can be considered “standard” in combined-cycle plants and in centralized M&D facilities serving multiple sites).
The webinar (access recording below) began with a technology primer, followed by four use cases (two narrated by a representative of TotalEnergies, the French energy company), a testimonial of sorts by Tetra Engineering, a well-known powerplant consulting firm, and a rather vibrant Q&A session.
The technology was initially applied by Electricite de France (EdF, the national electric utility) at nuclear plants in France. In 2018, the company began implementations at French combined-cycle facilities and quickly ramped up to “70+ plants and more than 450 users wordwide.”
Metroscope distinguishes its offering with these general features: Software-as-a-service business model, a thermodynamics-drive (deterministic) approach versus probabilistic, and holistic, systems-based diagnostics. While the presenters explained that users don’t need to add sensors in order to gain immediate value from the software, one expert did acknowledge that you’ll get better results from those subsystems which are properly instrumented. “Systems with few instruments are more like black boxes,” he said.
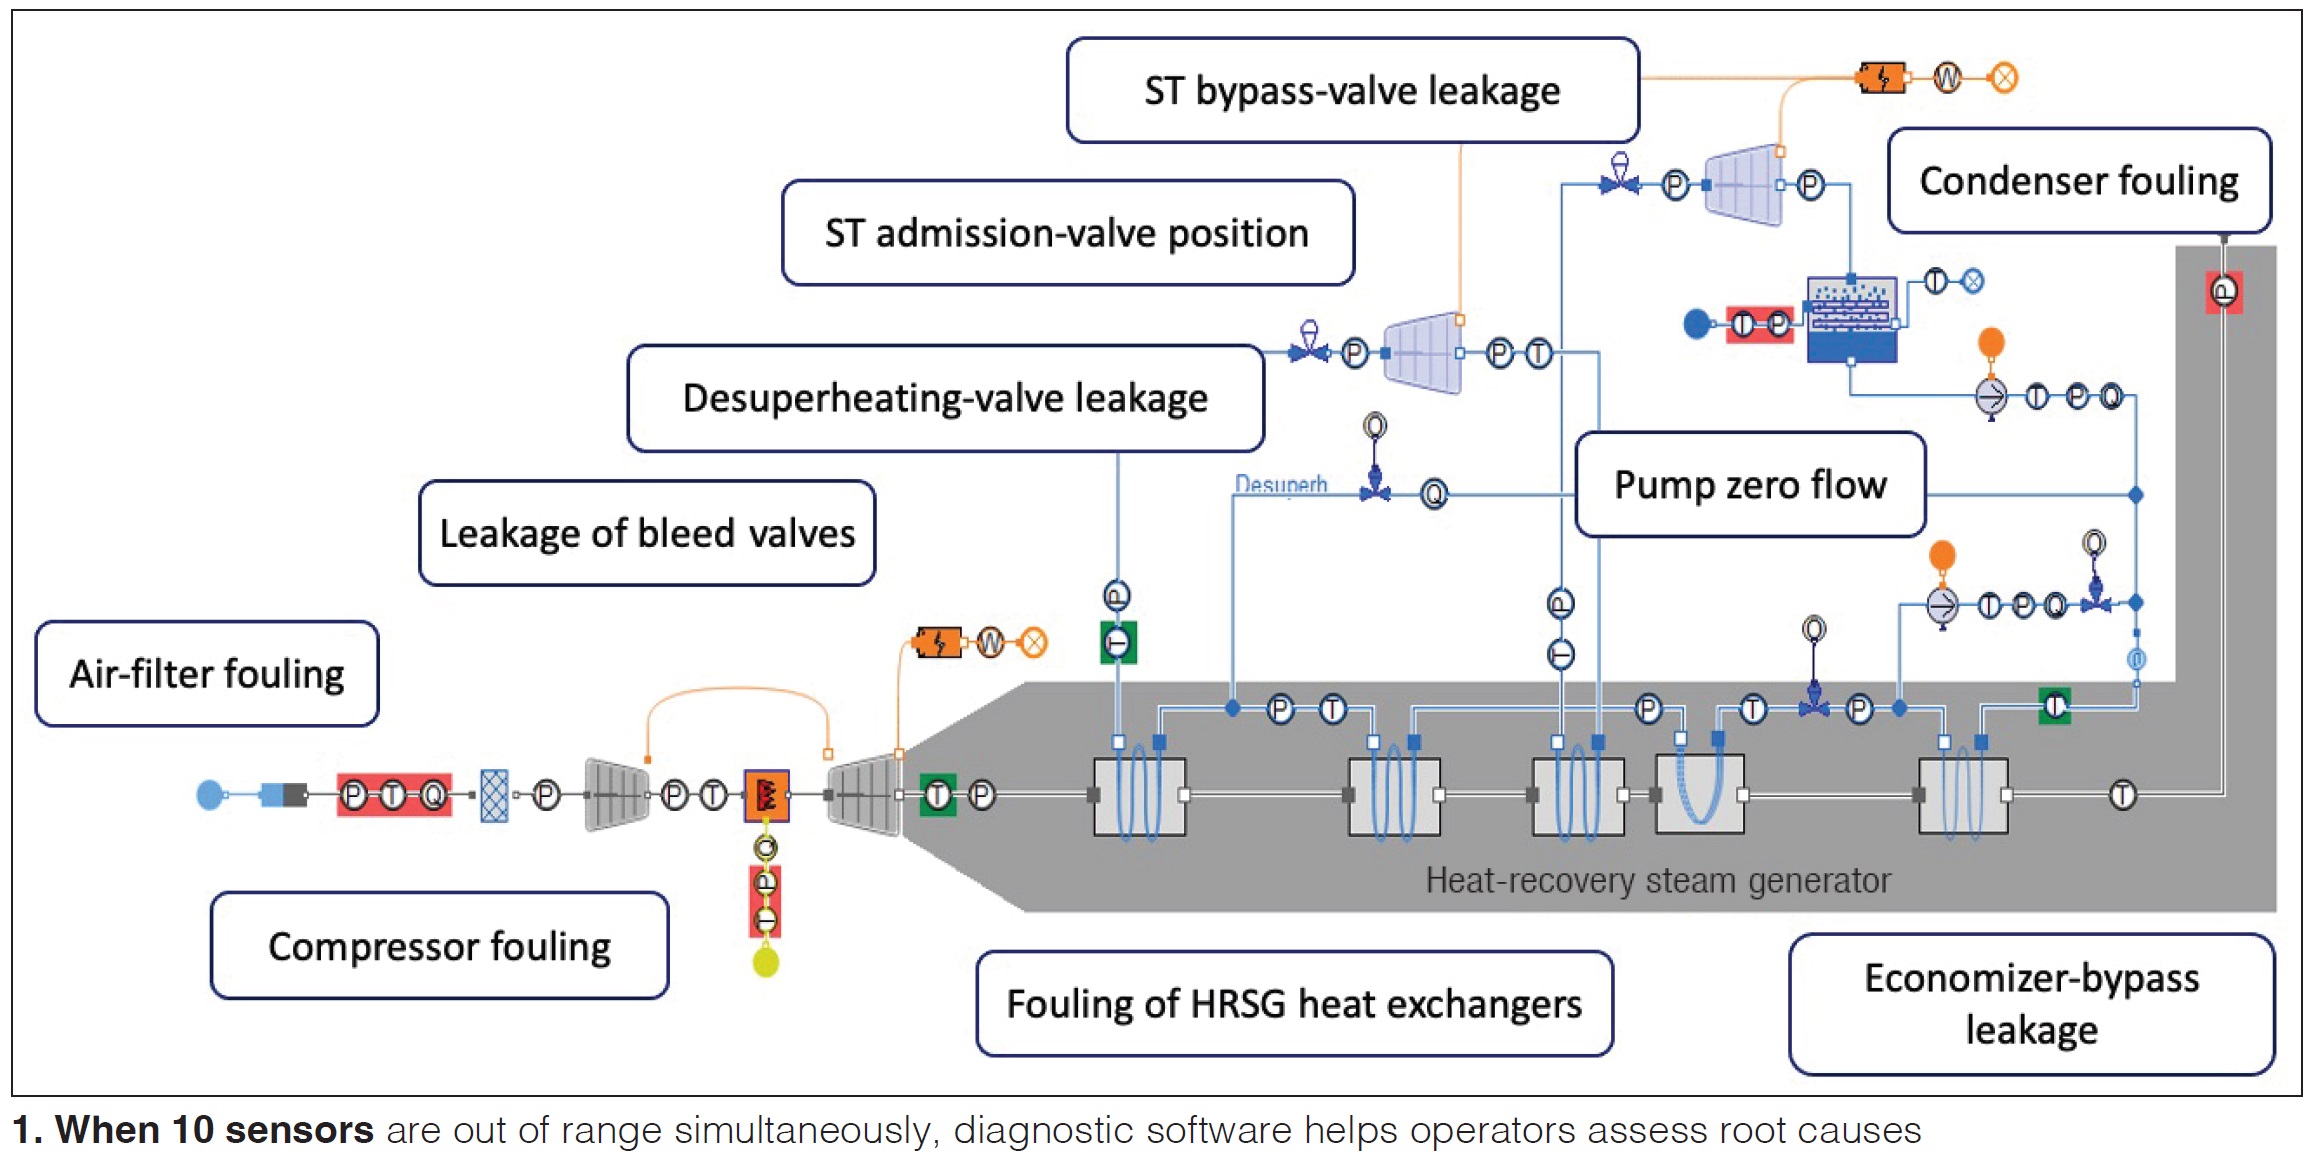
The technology presentation began with a typical situation, monitoring overload, faced by an operator (Fig 1) and the question: “Why are 10 sensor values trending mostly outside of their normal ranges?”

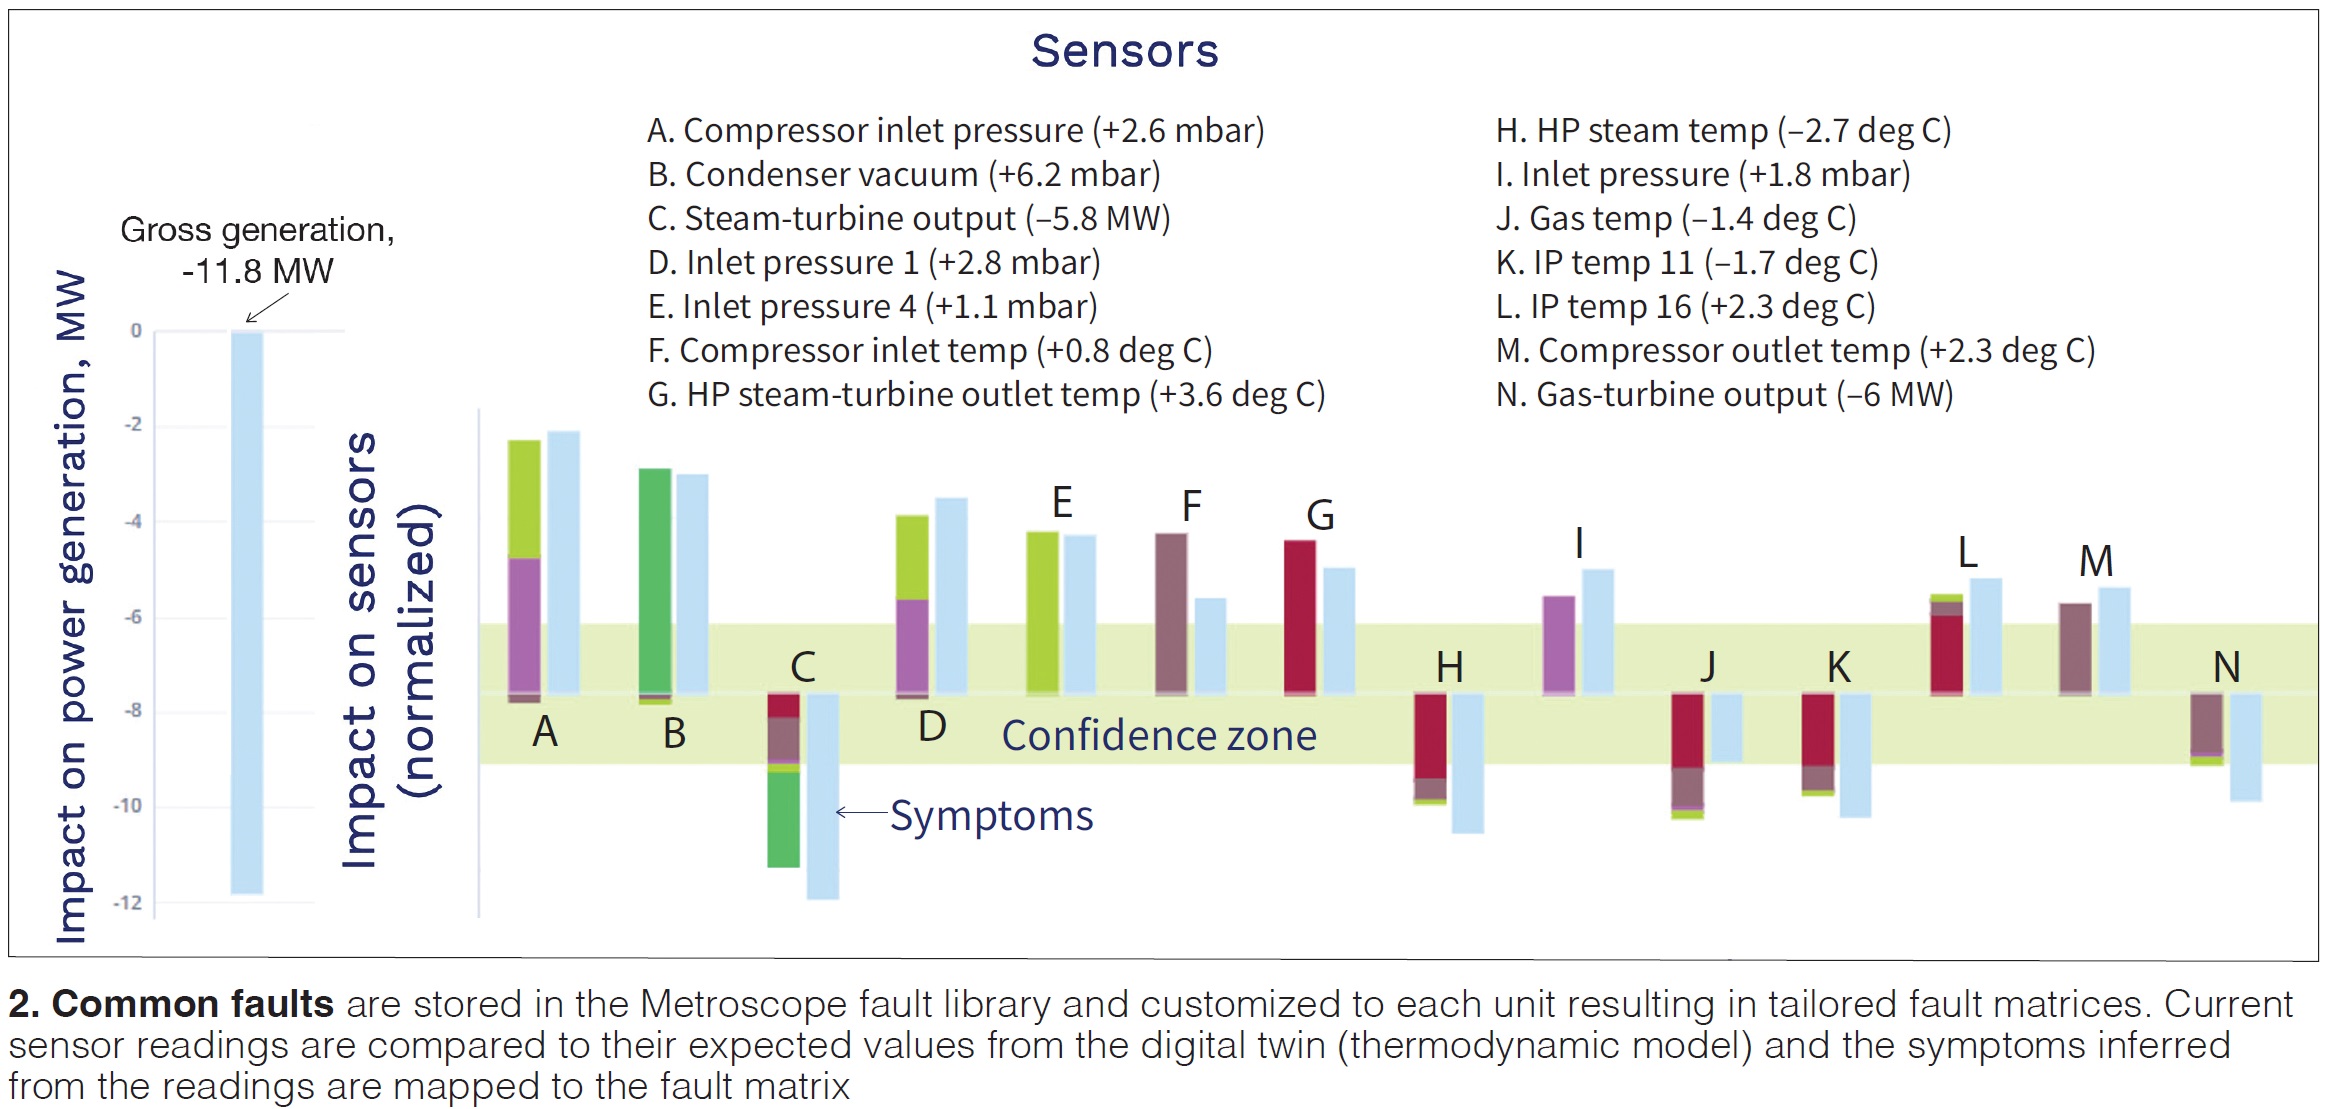
Like other diagnostic packages, Metroscope seeks to identify and correlate patterns in deviations from normal sensor values. However, the real advancement appears to be (1) the ability to map each sensor deviation, and patterns among them, to specific root causes; (2) indicate to staff the performance impact of a given issue or fault; and (3) suggest actions to address the fault. In other words, common faults (Fig 2), or actionable root causes, have an associated “signature” of sensor deviations.

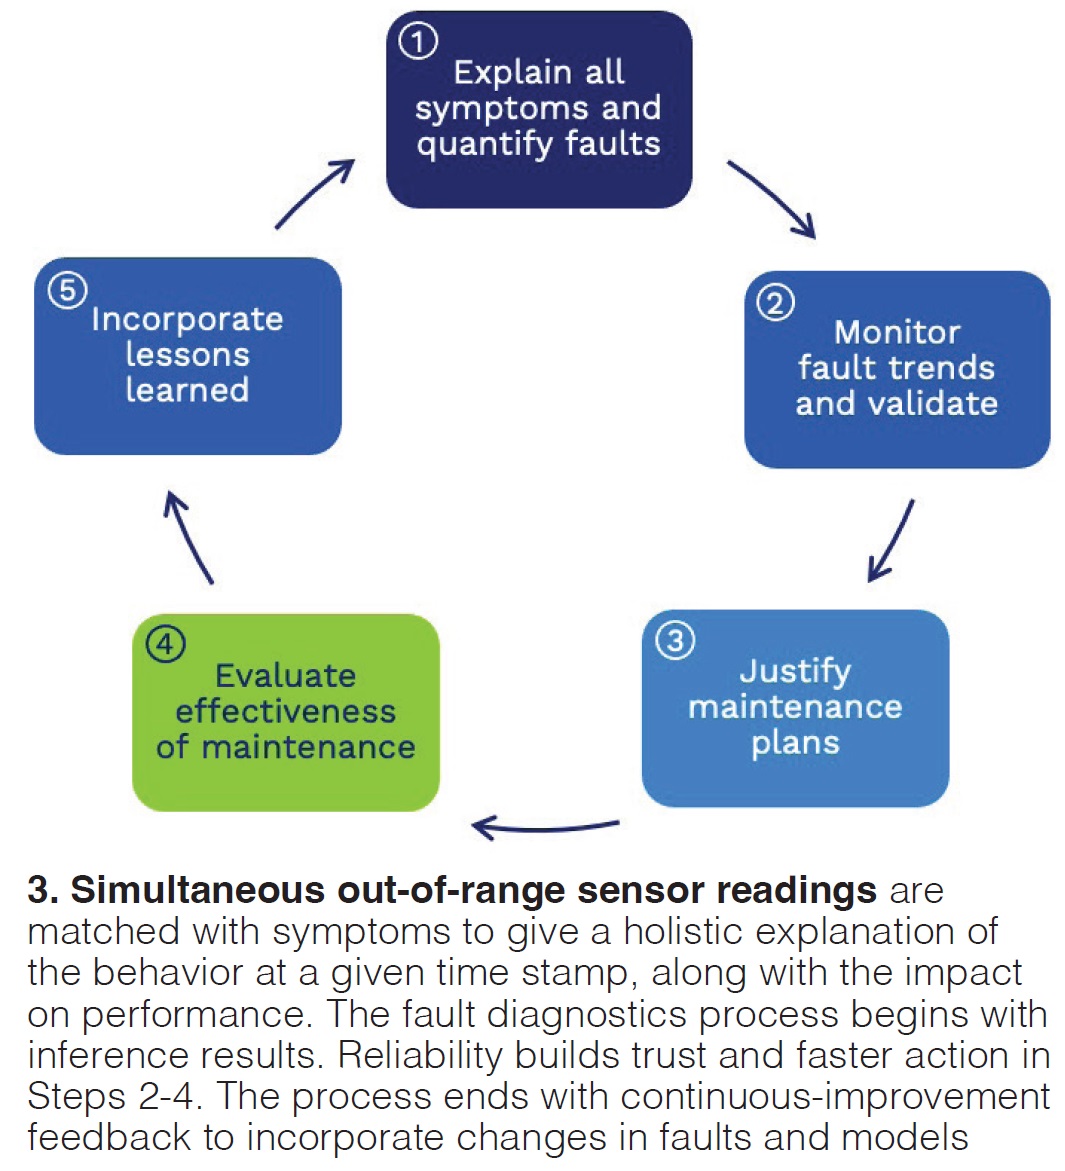
To do this, a “digital twin” (a thermodynamic model of the plant calibrated to its expected healthy behavior) is paired with an “inference engine.” The digital-twin outputs expected healthy behavior, while the sensor values over time indicate current behaviors. Symptoms, for example a steam leak, are detected. The inference engine analyzes the symptoms and then outputs diagnosed faults and their associated quantified impacts on performance (Fig 3).

Joe Hachem, TotalEnergies, described a use case involving a 440-MW combined cycle with SGT5-4000F gas turbines and a triple-pressure HRSG. The software detected fluid loss somewhere in the IP steam-turbine subsystem, but plant staff had no idea where. It was hard to locate the loss because IP system purges and bypasses are not well instrumented.
The Metroscope “diagnostic plot” (showing the deviations), and the impacts on other subsystems (for example, the condenser), pointed to the IP drain valves. Many sensors were deviating together which ruled out faulty sensors. IP drain valve leakage was monitored for 10 months. What started as a small, persistent, but worsening leak, soon had a real impact on performance.
At the next outage, the drain valves, and others, were investigated and fixed; 3.8 MW of output was restored. In this case, Metroscope detected a loss early, allowing the plant staff to focus on, monitor, and address it at the appropriate time.
The second use case involved a 400-MW plant with Ansaldo V94.3A gas turbines, and a similar configuration as the first example. This time, the area of interest is the condenser. The unit experienced a sudden loss of condenser vacuum, up to 14 mBar, which occurred right after an outage, with an associated 3- to 4-MW loss in output.
The Metroscope diagnostic plot pointed to the vacuum pumps. A list of impacted subsystems also was provided. DCS data showed that two vacuum pumps were operating simultaneously. A check of the inlet filters showed that they were completely clogged and were cleaned the next day.
In this case, the software indicated a problem that would have been difficult to detect, because of the lack of instrumentation (condensers are typically poorly instrumented, according to Hachem’s slides), and allowed the plant to prioritize the pumps in their investigation.
Metroscope’s Berenice Chanzy spoke on the next two use cases, one involving a compressor leak at a single-shaft, 9F-powered plant that was detected by the software. A close eye by plant staff on the issue showed that the performance impact had grown from a 4- to 10-MW loss after three months, with attendant increase in specific fuel consumption. A maintenance plan and outage, supported by the software’s insight, was executed in Month Four during which staff repaired an endoscope plug and inlet-bleed-valve flange. This work immediately restored 4 MW.
The last use case centered on the steam system in the same plant and a leak around the steam turbine, suspected by the staff but which could not be identified and was not visible from the outside. One fault (among 20 occurring at the same time) signature involved 11 sensors, but primarily steam temperature. The software confirmed the leak; early validation allowed the plant to monitor the leakage until something could be done about it.
These use-case descriptions are abridged. Listen to the recorded presentation if you want to know more. Be sure to review the slides elaborating on the basic technology.
David Moelling, chief engineer, Tetra Engineering, focused on the “actionable” nature of the Metroscope software’s suggestions and the early warning of issues costing money. “Earlier diagnostic systems [going back to the 1980s] involved too many instruments and hardware, not to mention staff resources,” he said.
Moelling listed these four relatable value points in today’s operating environment:
- Plant upgrades and life assessments. Diagnostics speed the setting of a baseline assessment for gas turbine and duct burner upgrades.
- Root-cause assessments. It is easier to determine the root cause of a failure with a diagnostic baseline.
- Freeze protection. Diagnostics help determine which instruments are being impacted by cold weather.
The Q&A session revealed some of the practical aspects of the software. For example, the software has to be calibrated, or trained, with several years of historical operating data, usually pulled from the PI archives. A typical deployment takes about six months, with a go-no go decision by the second month as to whether the software will provide value.
A user asking about the quality of the historical data elicited this response: “Make sure you have good data!” The software does have “some filtering strategies to deal with bad data.” The TotalEnergies rep noted that some data-quality issues did crop up, leading them to recheck data quality at all the sites using the software. Most of the data were fine, but there were some bad values.
One attendee was concerned that some sensor settings are “related to constants in the control system rather than the thermodynamics.” The response was that Metroscope doesn’t account for control logic, but rather the performance envelope and system effects,” and that “the longer the data history used to calibrate the software, the better the issue detection and outcomes under a wide variety of boundary conditions.”
Finally, with respect to the steam bypass system example, an attendee wondered why you would need the software to indicate a drain-valve issue when there may be two or more thermocouples with alarms in the control room already available to detect leakage. The response was that t/c values may be buried several screens deep to the operators and that the software also quantifies the leak and presents the performance impact. Also, the software may indicate adverse trends well ahead of alarm points.


